Important lessons can be learned in one of two ways: the easy way or the hard way. I prefer the easy way, but when it comes to Data Quality, it seems like I’m in the minority.
Last week we wondered aloud whether data quality really matters. This week we’ll see a graphic illustration of how it does.
Despite having what in retrospect was slightly impaired vision when I was growing up, I never had any problems with the blackboard. Maybe it was because the teachers wrote big enough or maybe it was because I could follow what they were saying well enough to figure out what they were writing. From my perspective, I didn’t have a Vision Quality problem … until I had to move to the front of the class because I couldn’t make out the caption when it was my turn to read the filmstrip (yes, filmstrip) in Social Studies class. I’ll never forget the comment the eye doctor made to my mom: “He doesn’t know that he needs glasses because he’s never seen clearly.”
Have you seen clearly the impact of incorrect data on your reports and models?
Probably not. Maybe your Marketing Analytics team did a Data Quality study once upon a time and implemented some data cleansing or other preprocessing before generating their reports. But that was once upon a time, and that’s more the exception than the rule. Besides, Data Quality usually cannot be evaluated in the first place because nobody knows what the data elements are actually supposed to contain.
Let’s put on our Data Quality glasses and see an example of exactly what incorrect data does to our models.
It’s NCAA Basketball Tournament season, so I coded up a simple basketball shooting simulation. A neural network was trained to find the required velocity of a shot given the x and y coordinates on the court and release angle θ. If you’re interested, the implementation details are at the end of the article.
In each simulation, the neural network was trained on a set of randomly generated input combinations, then tested using another randomly generated set.
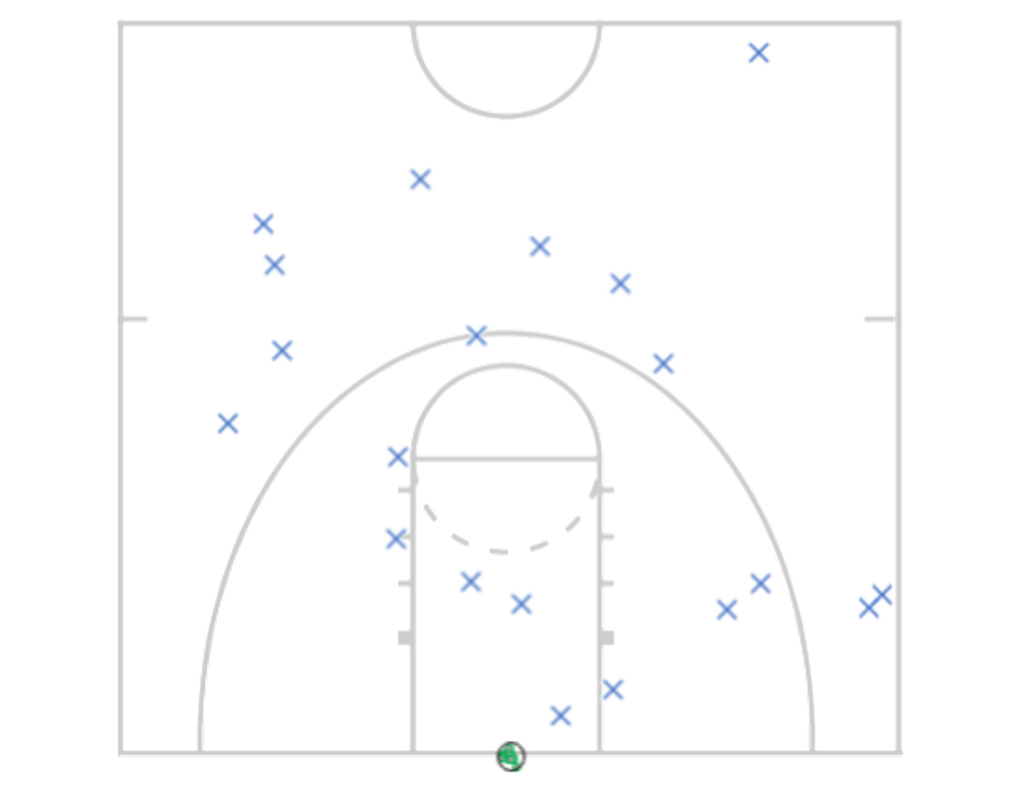
The first diagram shows the test set results for a network trained using accurate data. Shots were taken directly toward the basket from the blue Xs, and passed by or through the hoop at the green dots. The test shots all landed in a tight cluster right in the basket. Even the one from half-court at the buzzer. Swish!!
Now, let’s see what dirty data does to our shooting accuracy.
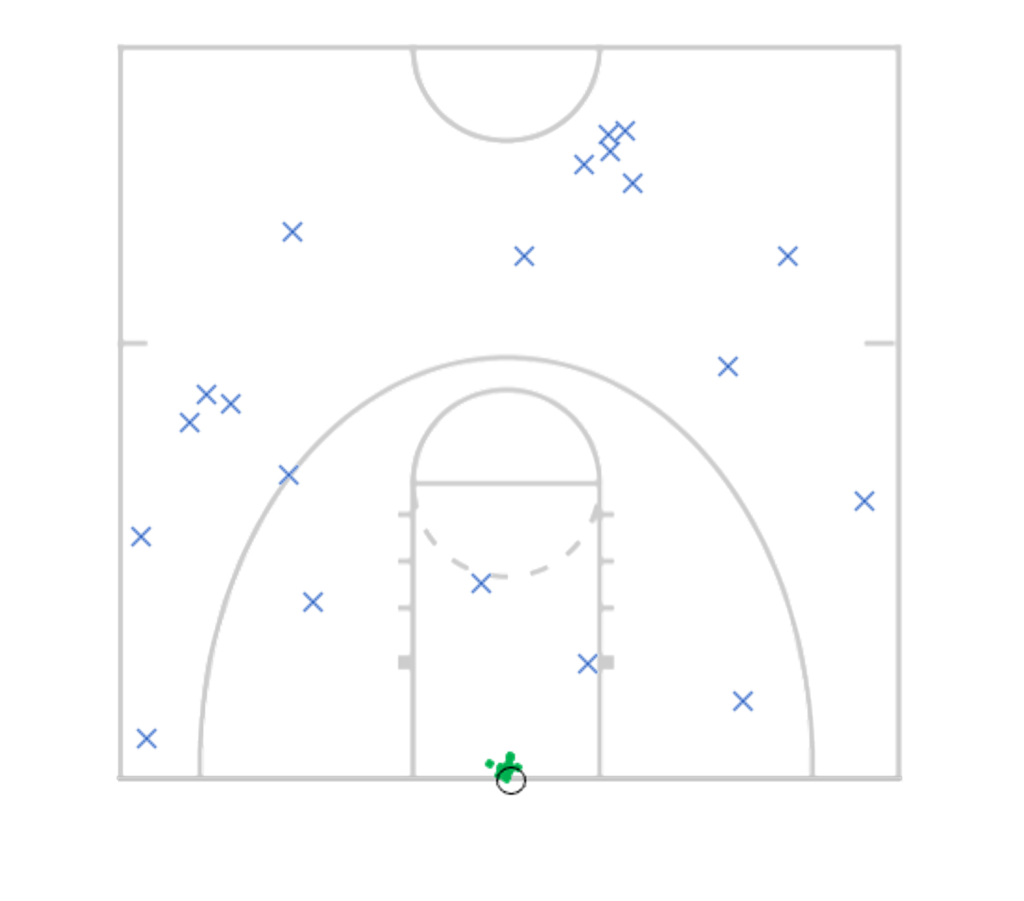
The network was retrained with noise introduced into the inputs, with each varying by as much as 10%. The results still looked pretty good and were still clustered pretty tightly. But six of twenty shots missed for a shooting accuracy of 70%. Lots of opportunities for offensive rebounds.
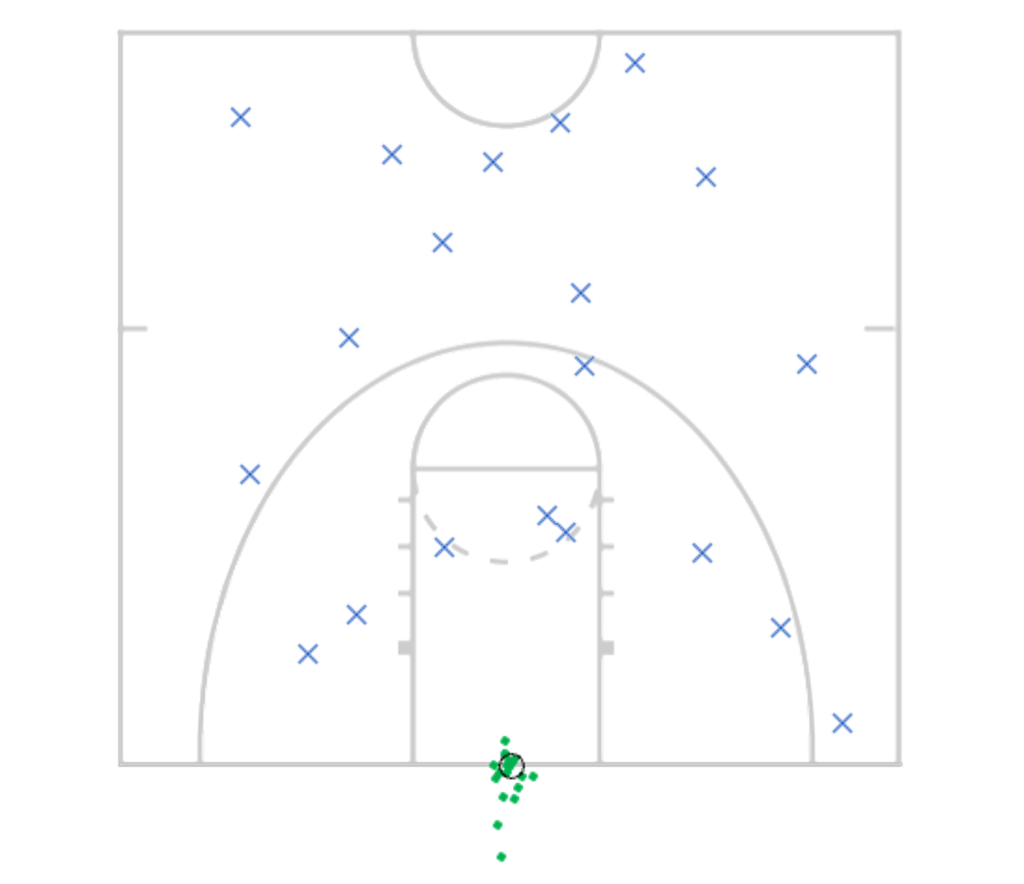
In the third test, the input data was correct but the target velocities could vary by up to 10%. Twice as many shots missed, the accuracy dropped to 40%, and the magnitude of the errors was much greater. This makes sense in this simulation since velocity errors have a much greater impact on the target location than origin coordinate errors.
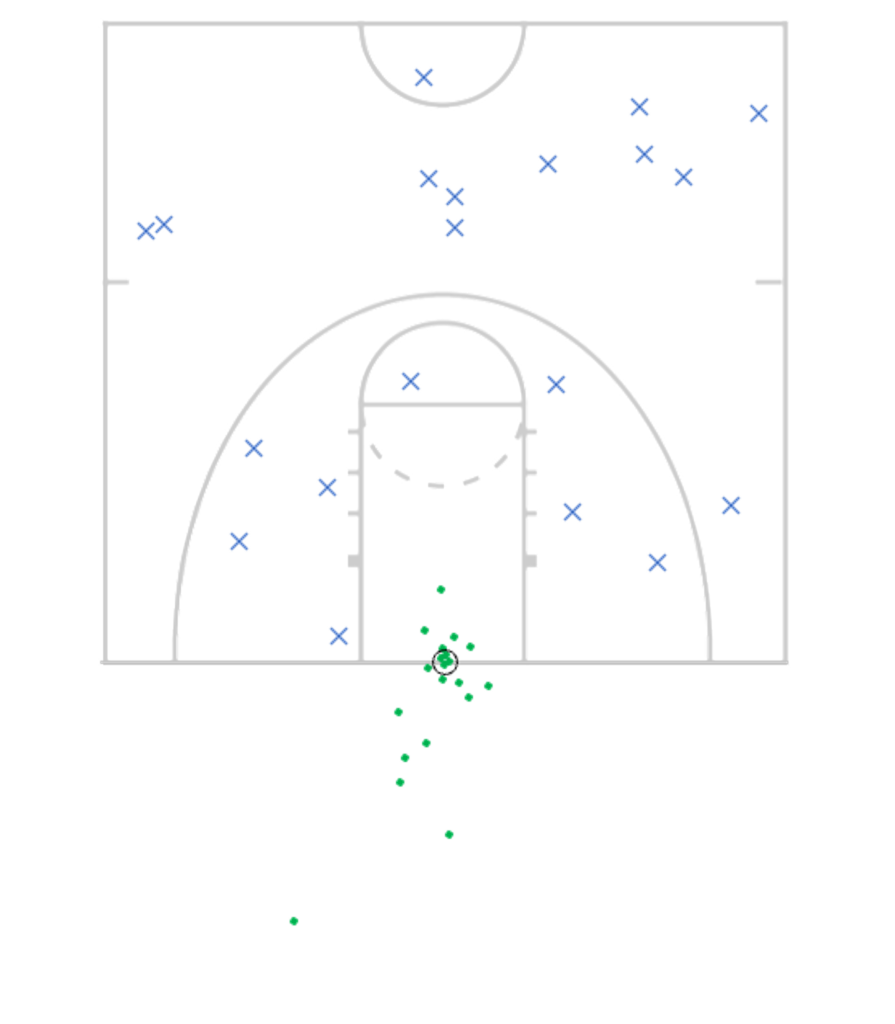
Just for fun, let’s look at what happens when the targets could be off by 30%.
The shooting percentage dropped to 25%, with only five of twenty shots managing to find the basket. Several of the errant shots missed wildly. Airball!!
Interestingly, adding training iterations did not substantively or consistently improve performance in any of the scenarios.
None of this should come as a surprise. It is axiomatic that errors cause problems with models. After all, garbage in, garbage out.
Dirty data places an upper bound on neural network performance and accuracy.
In all of these tests, model results were compared to the “correct,” calculated answers, making it easy to see how data accuracy impacted model performance. In the real world, the test set is usually drawn from the training set. The model may still fit the data it’s given, but if you don’t know that your data is dirty, you won’t know that your performance has been limited. And you won’t know by how much.
The time to worry about Data Quality, much like the time to worry about Data Security, is before something bad happens and you learn the hard way. Take a chance and learn the easy way.
Implementation Details
The physical model used the half-court dimensions of a regulation-sized college basketball court: 7.6m x 14.3m. To simplify the projectile motion calculations and to avoid mathematically undefined edge cases, it was assumed that 1) the basketball was shot from the same height as the rim; 2) the release angle could only vary from 10 to 80 degrees; 3) that the basket was centered on the out-of-bounds line in the middle of the court; and 4) the shots were always taken directly toward the basket.
Assuming 10 sq. cm. court shooting locations and 1 degree shooting angle granularity, approximately 761,000 different initial state coordinates are possible. It turns out, though, that from a practical standpoint, the entire search space can be more than adequately covered with less than 50,000 combinations. For this demonstration, a training set of 500 was used.
The fully-connected three-layer network and physical model were implemented using PyTorch. The network used three input nodes (x, y, θ), seven hidden nodes, and one output node (initial velocity). Each forward pass applied a linear transformation and sigmoid function to the incoming data, followed by standard backpropagation. Training ran for 200,000 epochs, but the loss curve usually elbowed at about 60,000 and had pretty much flattened out by 130,000.
College Men’s Basketball Half-Court Diagram from PrintablePaper.net.